Power BI for Public Works
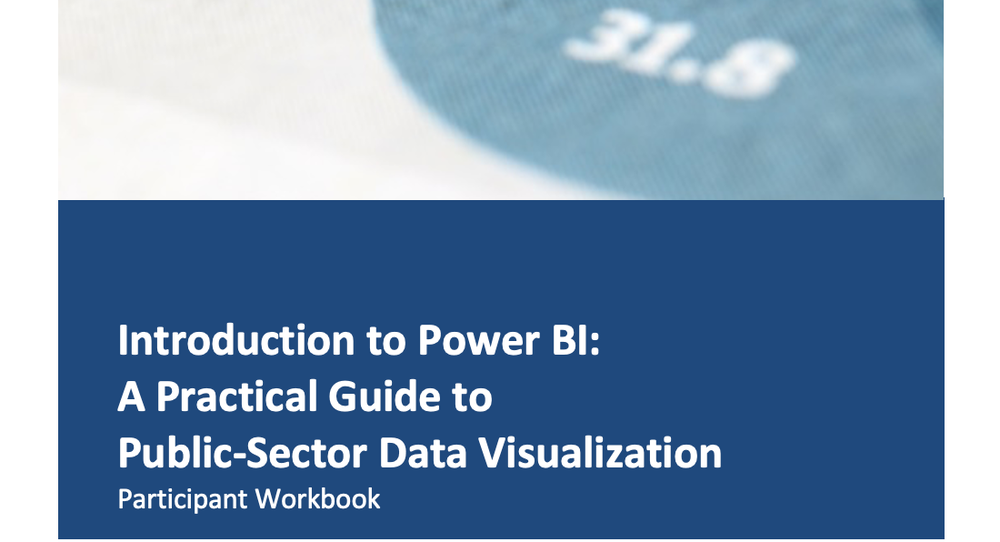
A county public works agency was standardizing on Power BI with no consistent training to get there. I built a two-day, hands-on course that takes their analysts and developers from raw service-request data to a finished six-page management dashboard — built live, in one file.
Project at a Glance
- Client: Large county public works agency
- Audience: 45 developers & analysts — comfortable with Excel, SQL, and databases
- Format: Two-day (16-hour) virtual instructor-led course, one progressive build
- My role: Designed and built the full course — curriculum, dataset, workbook, and slides
- Outcome: Every participant left with a working six-page dashboard and passed a timed, independent capstone build
One File, Six Pages, Two Days
The whole course is a single progressive build: participants work inside one Power BI file from the first minute of Day 1 to the last minute of Day 2. Every segment adds to what's already there — a new table, a new relationship, a new measure, a new report page — so the connections between concepts stay visible the whole way. By the end, the file on screen is the one they started with, now a six-page dashboard answering real operational questions.
A Scenario That Fits the Audience
The course runs on a 311-style service request dataset — residents reporting problems, the agency resolving them — a story a public-sector audience reads instantly. A five-table star schema drives six report pages, each answering one operational question. The course closes with a timed, independent capstone: build the view the Director needs before a leadership meeting, with no step-by-step help.
Built for Builders, Not Beginners
These were developers and analysts, so the course deliberately goes deeper than the exercises require: connection types, the SQL Power BI writes for you, the data gateway, and how database relationships differ from Power BI's model. The goal was a mental model that holds up in production — not a sequence of clicks that only works while the trainer is on screen.
Built to Outlast the Classroom
Participants got two materials with two different jobs: a step-by-step workbook to follow live (and rebuild from later), and the theory-carrying slide deck sent out afterward as a PDF — so the explanations for concepts like filter context are still there months after the session.
What the Course Covers
Zero shared Power BI process to a finished, functional dashboard — the full pipeline:
- Data foundations: The full connection landscape, Power Query and ETL, and normalizing raw data into a usable state.
- Modeling: A five-table star schema, date tables and time intelligence, and how Power BI relationships differ from database relationships.
- DAX: Measures vs. calculated columns, COUNTROWS, AVERAGE, CALCULATE, and filter context.
- Dashboards & delivery: KPI cards, matrices, slicers, maps, drillthrough, Excel integration, and publishing to a shared workspace.
- Independent capstone: A timed, build-it-yourself final project — the real test of whether the skill stuck.
Interested in working together?
Whether you're building out technical training, enabling a team on a new platform, or just want to talk shop - I'm always down to connect.
Let's Connect
© 2026 iTechnically Kan. Digital Literacy for Everyone. Privacy Policy